Spatial Transcriptomics Core

The Spatial Transcriptomics Core is a newly established core at the University of Pennsylvania School of Dental Medicine, featuring the 10X Genomics Xenium Analyzer for highly multiplexed in situ RNA imaging at a single-cell level. The core is open to researchers throughout Penn and surrounding communities.

Spatial Transcriptomics Core Data Highlights

  • Mouse nasal tissue section with the V1 Mouse Multi-Tissue Atlassing panel. Image shows olfactory turbinate with both olfactory epithelium (green cluster) and respiratory epithelium (purple cluster). These two cell populations can be identified by transcripts OMP (red points) and Reg3g (green points). Image courtesy of Dr. Eric Larson studying airway chemosensory cells and taste-signaling pathways. Generated using 10x Genomics Xenium Explorer 3.2.0
  • Mixture of Jurka and Raji cells. A. DAPI image. B. Cell clustering results. C. Transcripts CD3D (green) and POU2AF1 (red) labeling each of the identified cell clusters. Image courtesy of PDM Spatial Transcriptomics Core. Generated using 10x Genomics Xenium Explorer 3.2.0
  • Distal segment of the ileum in Swiss Rolls using 5K Prime Mouse panel showing Muc2 transcript localization. In this study, Xenium In Situ was used to dissect spatial dynamics of the immune response in modeling intestinal pathogens. Image courtesy of Dr. Daniel Beiting, School of Veterinary Medicine, UPenn. Generated using 10x Genomics Xenium Explorer 3.2.0
  • Mouse laryngeal cross section using the V1 Mouse Multi-Tissue Atlassing panel. A. Cell clustering shows separation of multiple cell types. B. Heatmap of overall transcript signal showing high density of transcript signal in laryngeal (top) and esophageal (bottom) epithelium. Image courtesy of Dr. Eric Larson studying airway chemosensory cells and taste-signaling pathways. Generated using 10x Genomics Xenium Explorer 3.2.0
  • Mouse laryngeal cross section using the V1 Mouse Multi-Tissue Atlassing panel. A. Xenium Morphology image as captured by Xenium Analyzer used for cell segmentation algorithm. B. Cell clustering results. C. Scgb3a2 transcript (green points) and Dcpp2 transcript (yellow points) define cell populations in the tissue. Image courtesy of Dr. Eric Larson studying airway chemosensory cells and taste-signaling pathways. Generated using 10x Genomics Xenium Explorer 3.2.0

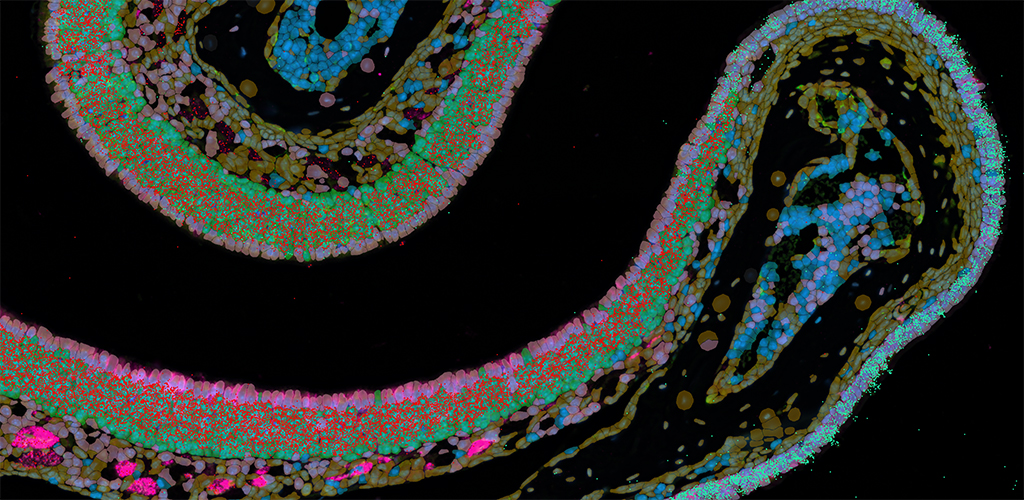
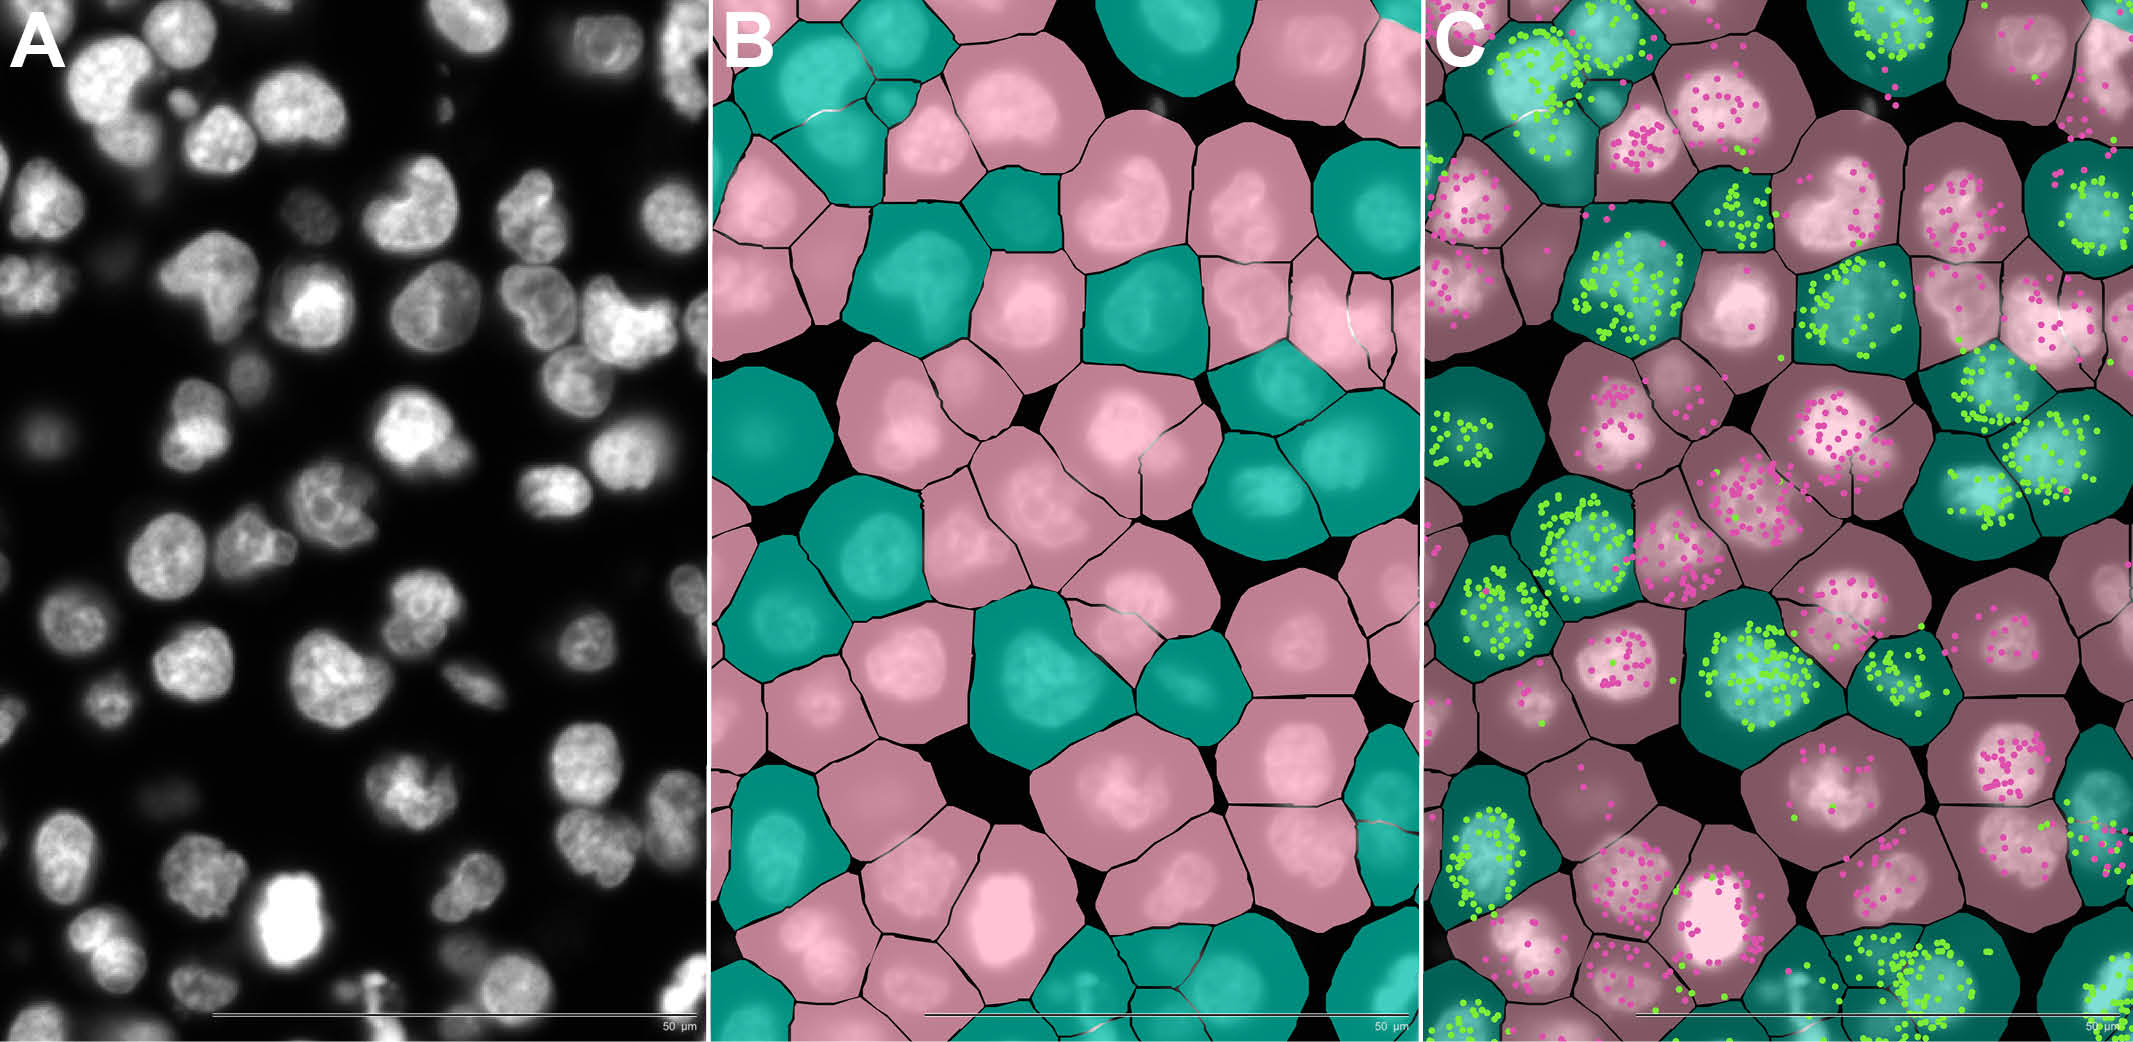
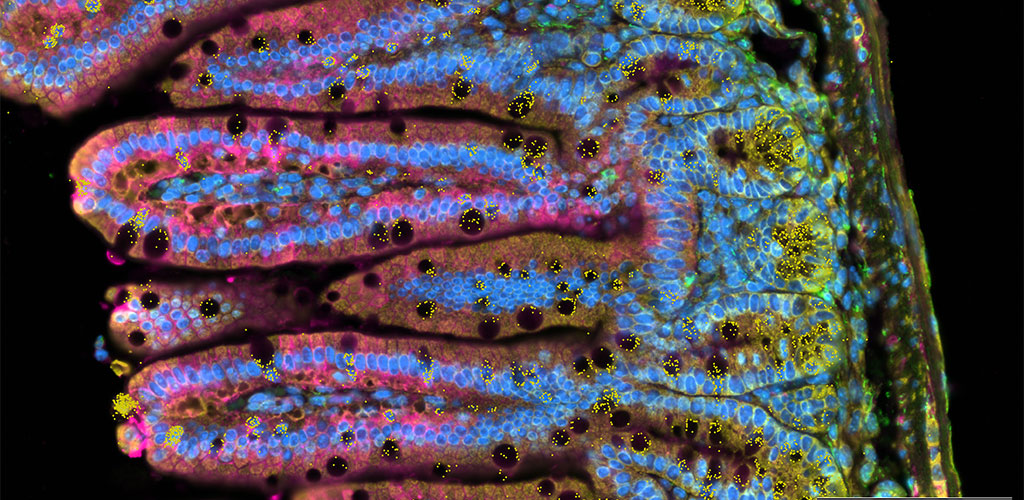
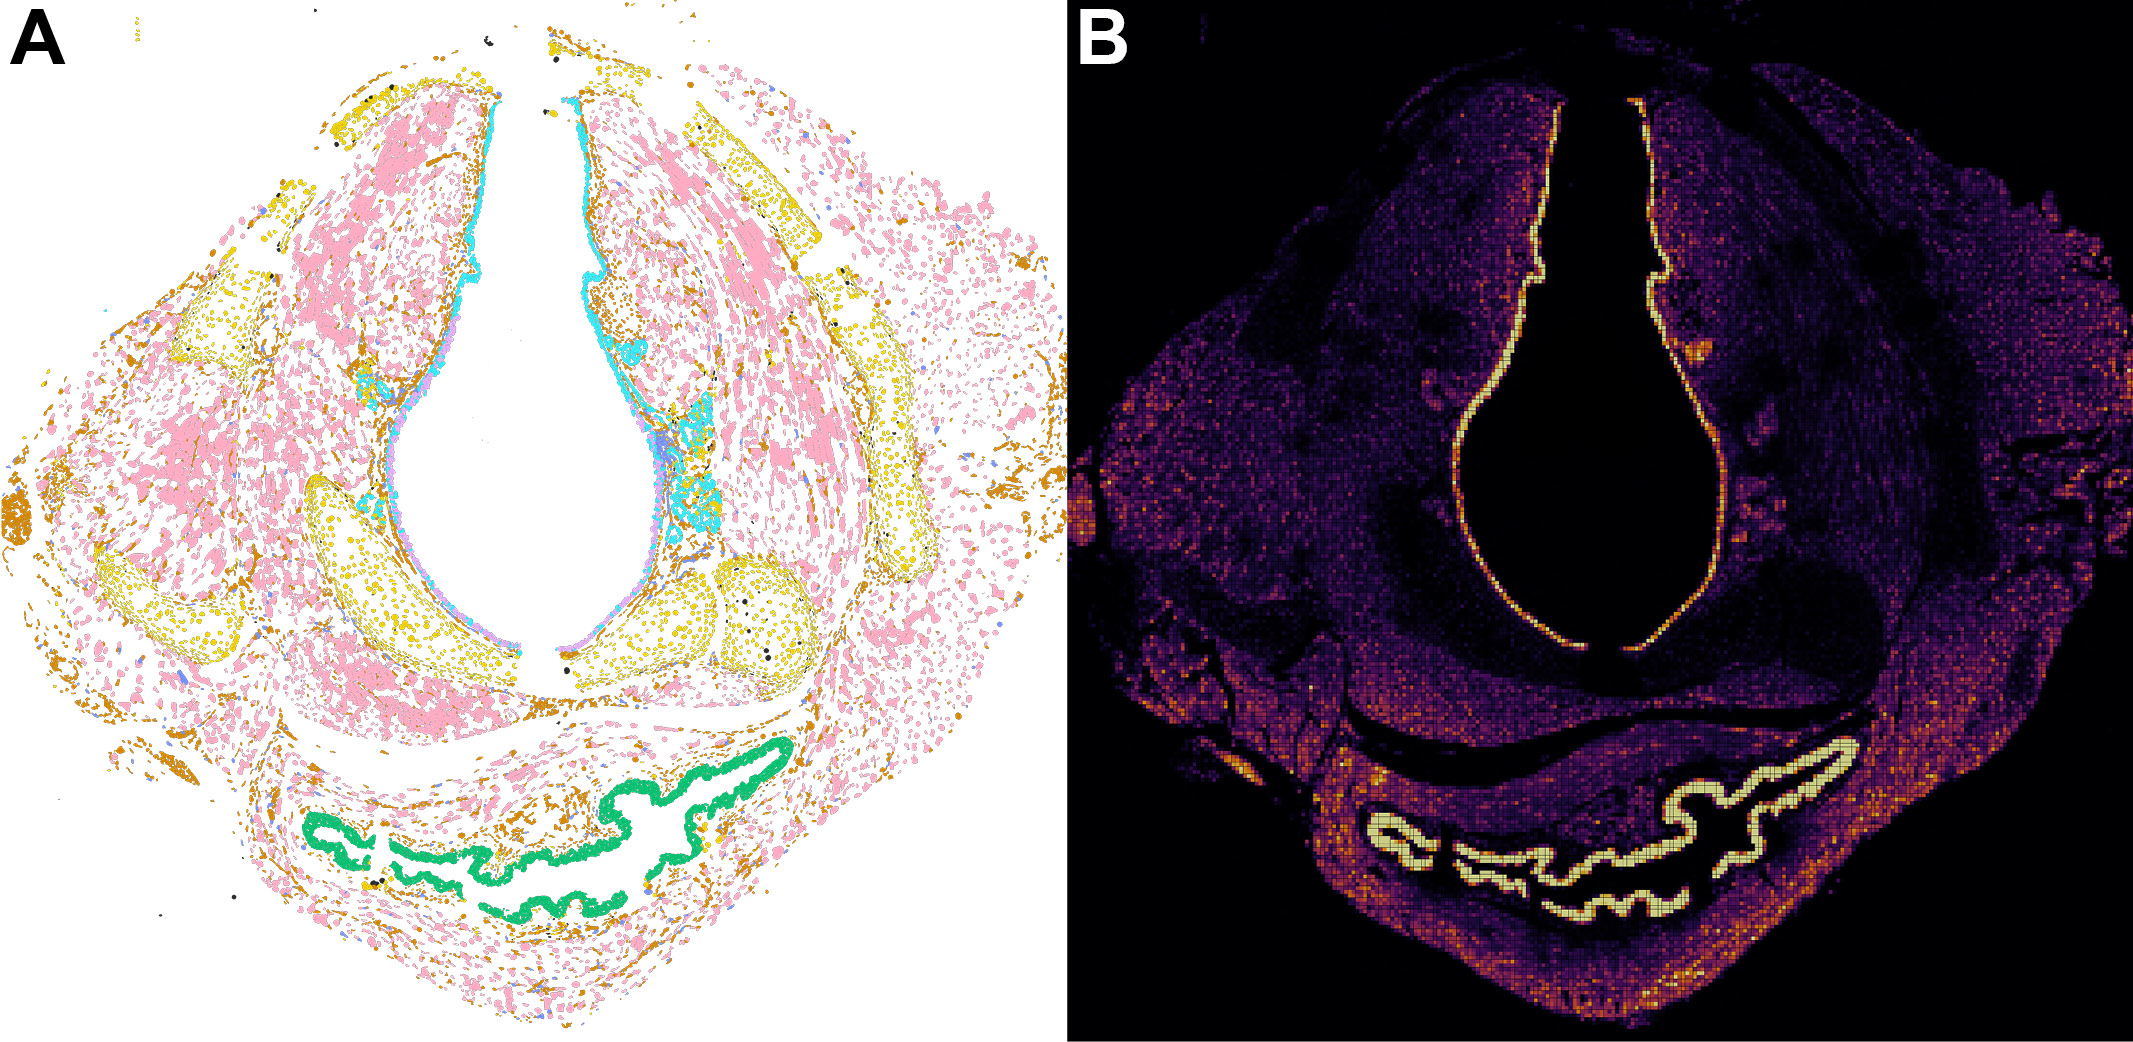
The Spatial Transcriptomics Core at University of Pennsylvania School of Dental Medicine is open and accepting samples. This core features the 10X Genomics Xenium Analyzer for highly multiplexed in situ RNA imaging at a single cell level. The core is open to the Penn and surrounding communities. Users will have access to pre-experiment consultation, specimen sourcing and sectioning assistance, full service Xenium workflow by dedicated core staff, and multiple options for downstream data analysis.

The core is located on the 4th floor of the Levy Building, Room 429. In addition to housing all of the necessary equipment for successful Xenium runs, the core shares space with the Tissue Processing and Imaging Core which houses specialized histology equipment and an Olympus VS200 slide scanner.

Personnel

Dr. Eric Larson, Core Director, larsoned@upenn.edu. Dr. Larson is an Instructor in the Basic and Translational Science Department. He has an extensive background with both wet-lab and bioinformatics experience. He has expertise with single-cell physiology techniques including patch clamping and calcium imaging and anatomical techniques including histology, immunofluorescence, in situ hybridization, and advanced light microscopy. Currently, alongside directorship of the STC, Dr. Larson focuses on bioinformatic support for multiple investigators projects. These projects include bulk RNA sequencing, alternative splicing , single-cell transcriptomic, and spatial transcriptomic analyses.

Dr. Juyoung Park, Technical Director, juyoungp@dental.upenn.edu.

  • Full service workflow We offer full service from sample sectioning to data analysis. Hand us your samples or slides and we will do the rest.
  • Minimize per sample costs – Work with our team to maximize the number of tissue sections that fit on a Xenium slide to increase the value of your experiment
  • Experiments to fit your needs – We offer services for Prime 5K (5000 gene targets) and V1 (300-500 gene targets)
  • Advantages of Xenium – Xenium In Situ platform offers high-resolution imaging and mapping of up to 5,000 transcripts
    • Subcellular resolution – With an advanced cell segmentation algorithm, RNA expression can be pinpointed at the subcellular level, providing insight to cellular function within tissue sections
    • Targeted gene panels – Predesigned gene panels to identify a wide variety of cells in specific tissues
    • Customized gene panels – Add on up to 100 custom targets to any pre-designed panel, or design your own fully custom panel (*up to 500 genes, V1 only)
    • High throughput – Tissues are placed on Xenium slides, each with a maximum capacity of ~2.3 square cm. Visualize hundreds of thousands of cells and millions of transcripts in a single run
    • Variable sample sizes – analyze one large tissue section per slide or multiple smaller sections. For reference, 3 coronal sections of mouse brain could fit on a single slide.
    • Multimodal analysis – Visualize RNA transcript along with protein targets in a single run (** Reagents to be available by mid 2025)
    • Tissue preservation – After Xenium analysis is complete, tissue sections are intact and able to be processed in downstream applications including immunofluorescence, H&E, or even 10X Genomics Visium
    • User friendly – Intuitive software for easy data visualization

  • Experimental consultation – Meet with Core staff to discuss your project, learn about Xenium workflow, discuss experimental design.
  • Sample sectioning, optimization, and QC – In partnership with the Tissue Processing and Imaging Core, we offer sample sectioning to Xenium slides,  QC imaging including DAPI and H&E, and sectioning optimization to maximize the number of samples that can fit on a single Xenium slide.
  • Xenium workflow and run – Our staff will process your sectioned slides and run the Xenium analyzer.
  • Post-run summary – All runs include a post-run meeting which includes an overview of the results and a brief tutorial on the usage of Xenium Explorer software so you can browse the data on your own.
  • Advanced data analysis – For investigators who need more in-depth analysis, Dr. Larson is able to provide advanced single-cell spatial analyses (cell signaling analyses, trajectory inference analyses, spatial clustering, cross-condition analysis and more). This can be included as an add-on service (billed hourly) or by supporting a portion of Dr. Larson’s effort with grant funding.

Other Penn Dental Medicine Core Facilities

Tissue Processing & Imaging Laboratory »

Live Cell Imaging Core »